
Draw an accurate graph by making a table of values, choosing sensible axes and a clear scale, plotting each ordered pair precisely, then drawing and labelling the correct curve. Use GeoGebra or Desmos afterwards to check your work rather than to produce it. Revision guides can help you practise this method against real exam questions before you sit a paper.
TL;DR:
- Building an accurate graph requires plotting a table of values with carefully chosen x-values and a consistent scale based on the 1, 2, 5 progression.
- Recognising the characteristic shape of functions, such as symmetry in quadratics or asymptotes in reciprocal graphs, helps prevent basic plotting errors.
- Applying transformations algebraically before sketching ensures correct shifts and stretches, especially for combined or complex functions.
- Using graphing software like GeoGebra or Desmos for checking helps identify errors, but exams demand hand-drawn plots with visible working for full credit.
- Showing a detailed table, labeled axes, and key features on your graph secures method marks, even if your final curve is not perfectly to scale.
Table of Contents
- Step-by-step plotting method: from table of values to final curve
- Sketching common graph families and the features examiners expect
- How to get transformations right without guessing
- Using GeoGebra, Desmos and spreadsheets to check your work
- Quick exam checks and common mistakes that cost marks
- MathVault resources and worked solutions to practise accurate graphing
- Why sketching improves exam performance and mathematical understanding
- Practical next steps to practise accurate graphing
- Sources
- FAQ
Step-by-step plotting method: from table of values to final curve
Every accurate graph starts the same way, whether you are plotting a straight line or a cubic. The method below works for any function you meet at GCSE or A-Level.
- Choose x-values that suit the function: for a quadratic, pick values either side of the vertex so your table shows the symmetry; for most other functions, evenly spaced integers are fine.
- Substitute each x-value into the equation and record the y-value, checking one calculation twice before moving on.
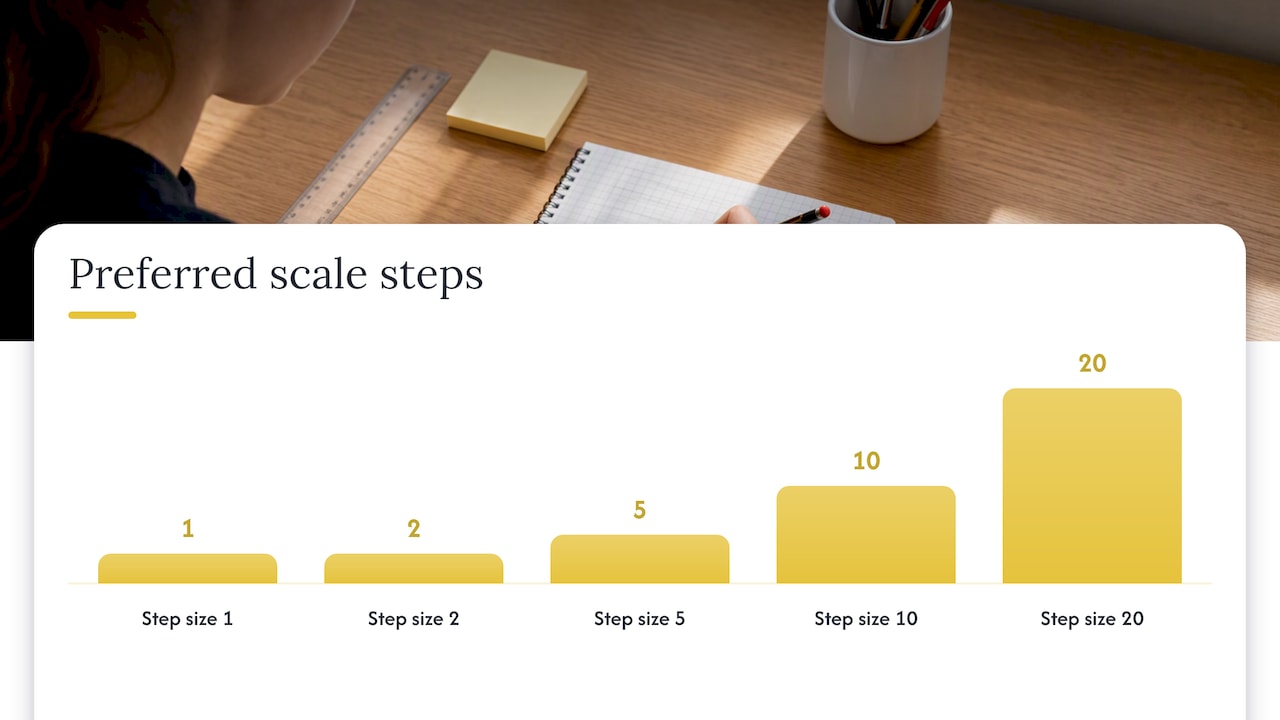
- Choose axis ranges so your plotted data fills more than half the grid in each direction, then pick a scale using the 1,2,5 progression (1, 2, 5, 10, 20, 50…) recommended in RGS graph-drawing guidance, since it keeps interpolation simple.
- Plot each ordered pair by moving along the x-axis first, then up or down to the y-value, marking a small, clear point or cross.
- Join the points with a ruler for straight lines, or a smooth freehand curve for quadratics, cubics and trig functions, never a series of short straight segments.
- Label the curve with its equation, and label both axes with their variable and units where relevant.
- Check your work: substitute x = 0 and y = 0 to confirm intercepts match your plotted graph, and re-read your scale labels for consistency.
This sequence mirrors the process BBC Bitesize sets out for plotting a linear equation: build the table, choose axes that cover every coordinate, plot the points, then draw the line.
Pro Tip: Annotate your table of values on the graph paper itself. If you run short of time, an examiner can still award method marks from visible working, even if the final curve is imperfect.
Sketching common graph families and the features examiners expect
Recognising a function’s shape before you plot it saves time and prevents basic errors. AQA’s guidance on sketching and recognising functions expects students to identify the characteristic shape of a graph, not just plot a cloud of points.
- Linear graphs: show the gradient and y-intercept clearly, and use a ruler through two or three calculated points rather than joining freehand.
- Quadratic graphs: mark the vertex, found using $-b/2a$ or by completing the square, along with the axis of symmetry and both intercepts where they exist.
- Reciprocal graphs: label the vertical and horizontal asymptotes and state any restricted values, then sketch each branch as a smooth curve approaching but never touching the asymptote.
- Trigonometric graphs: recall the parent shapes of sine, cosine and tangent over 0 to 360 degrees, then mark amplitude, period, phase shift and any vertical translation.
- Cubic graphs: focus on end behaviour and turning points rather than plotting every value, since the overall shape matters more than a dense table.
A sketch does not need to be perfectly to scale to earn marks, but it must show these decisive features and be labelled clearly enough for an examiner to follow your reasoning.
How to get transformations right without guessing
Transformations catch out students who try to picture the shift directly from the equation. The safer route is algebra first, drawing second.
- Rewrite the function so the horizontal scale and shift are visible, factoring the input where needed: for example, $cos(2x – 90°)$ becomes $cos(2(x – 45°))$, revealing a horizontal scale factor of a half and a shift of 45 degrees, as shown in OCR’s sketching topic exploration pack.
- Apply horizontal transforms to the x-coordinates of your decisive points (intercepts, turning points, asymptotes), and apply vertical transforms to the y-coordinates.
- When a function combines several transforms, work through them in the order the algebra dictates rather than trying to visualise all of them at once, tracking how each key point moves at each stage.
For a quadratic such as $y = 2(x-3)^2 + 1$, the vertex of $y = x^2$ at $(0,0)$ maps to $(3,1)$, stretched vertically by a factor of two. The same logic applies to trig functions: factor first, then move each marked point in turn, following the AQA guidance on transformations.
Pro Tip: Always factor the input before reading off a horizontal shift. Skipping this step is the most common reason students get the direction of a horizontal transformation backwards.
Using GeoGebra, Desmos and spreadsheets to check your work
Digital tools are excellent for verification and exploration, but exam boards still expect the hand-drawn method for coursework and written papers.
- Plot the same function in GeoGebra or Desmos and compare the intercepts, turning points and asymptotes against your hand-drawn version.
- Use a spreadsheet to generate a table of accurate decimal values for awkward points that are hard to calculate by hand.
- Drag sliders in GeoGebra or Desmos to see how changing a, b, c or k reshapes a graph, which builds intuition for transformations before you meet them in an exam question.
- Treat software as a check, not a substitute: OCR’s transition guidance recommends building confidence with graphing software while still practising the hand method required in exams.
A quick spreadsheet table of values, as discussed in general data analysis practice, can also help you spot arithmetic slips before you commit a point to graph paper.
Quick exam checks and common mistakes that cost marks
A few habits separate an accurate graph from one that loses marks despite correct working.
- Always show your table of values or key substitutions: this earns method marks even if your final curve has a small error.
- Never join non-linear points with straight segments; a quadratic or cubic needs a smooth curve.
- Confirm intercepts by substituting x = 0 and y = 0 rather than reading them off an imprecise sketch.
- Choose a scale using the 1,2,5 ladder and label both axes with units where they apply.
- If you are short on time, annotate your decisive calculations rather than attempting to re-plot the whole curve.
Method marks reward visible working, and NRICH’s guidance on sketching graphs notes that an exam sketch does not need to be perfectly to scale, provided it clearly shows and justifies the salient features. Showing your reasoning on the page is often what secures the mark, not just the finished curve.
MathVault resources and worked solutions to practise accurate graphing
Various online platforms offer board-aligned past-paper packs, fully worked step-by-step solutions, topic revision guides and live weekly Q&A sessions, often free to access for students preparing for GCSE and A-Level maths. Working through past graphing questions with a full solution alongside your own attempt shows you exactly where method marks are awarded for plotting and transformations, not just where the final answer differs.
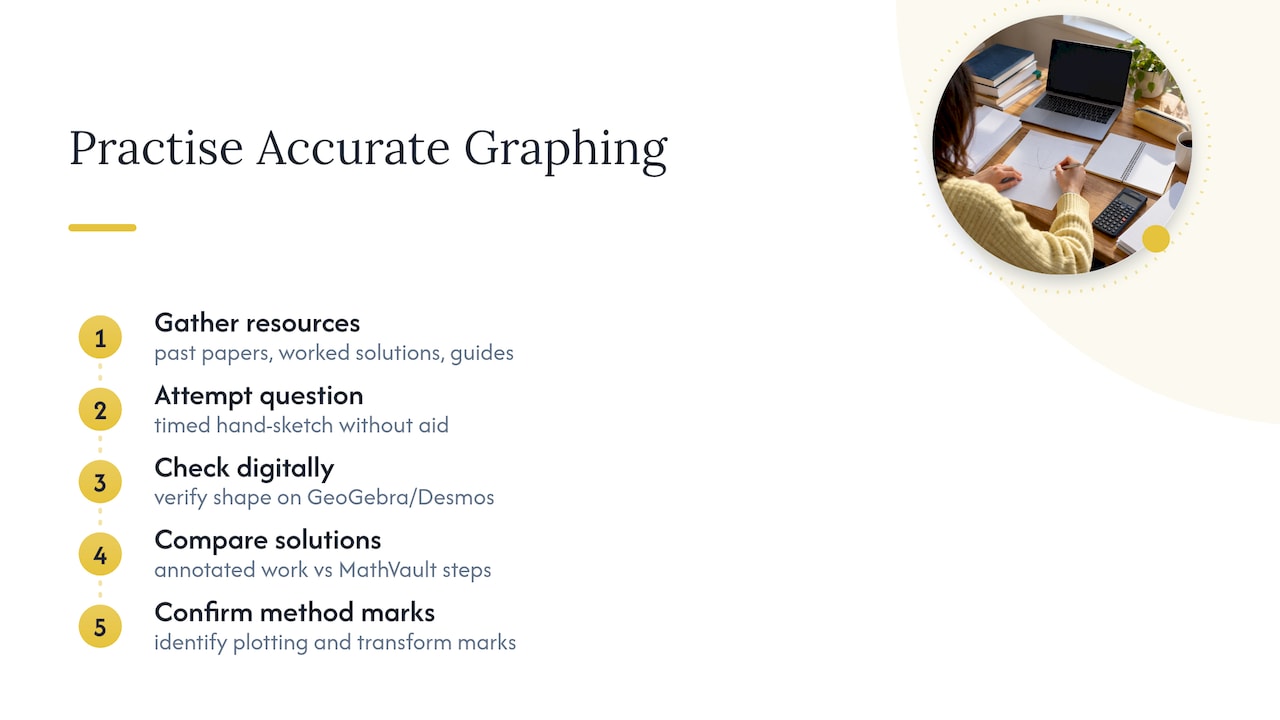
Pair timed hand-sketch practice with a check on GeoGebra or Desmos, then compare your annotated working against a MathVault worked solution to see whether an examiner would award the method marks you expect.
Why sketching improves exam performance and mathematical understanding
Sketching a function often reveals relationships that algebra alone hides, which is why it rewards deliberate practice rather than last-minute revision. Try short, timed sketch drills, check each one against GeoGebra or Desmos, and annotate your reasoning as you go. Live Q&A sessions and revision packs are a useful place to get that reasoning checked.
— Oloru
Practical next steps to practise accurate graphing
Practising the method above against real exam questions is what turns it into a reliable exam skill, and some online resources are built for exactly that. Our GCSE maths revision guides organise topics including graph sketching and transformations, with fully worked solutions so you can check your own plotting against a marked answer.
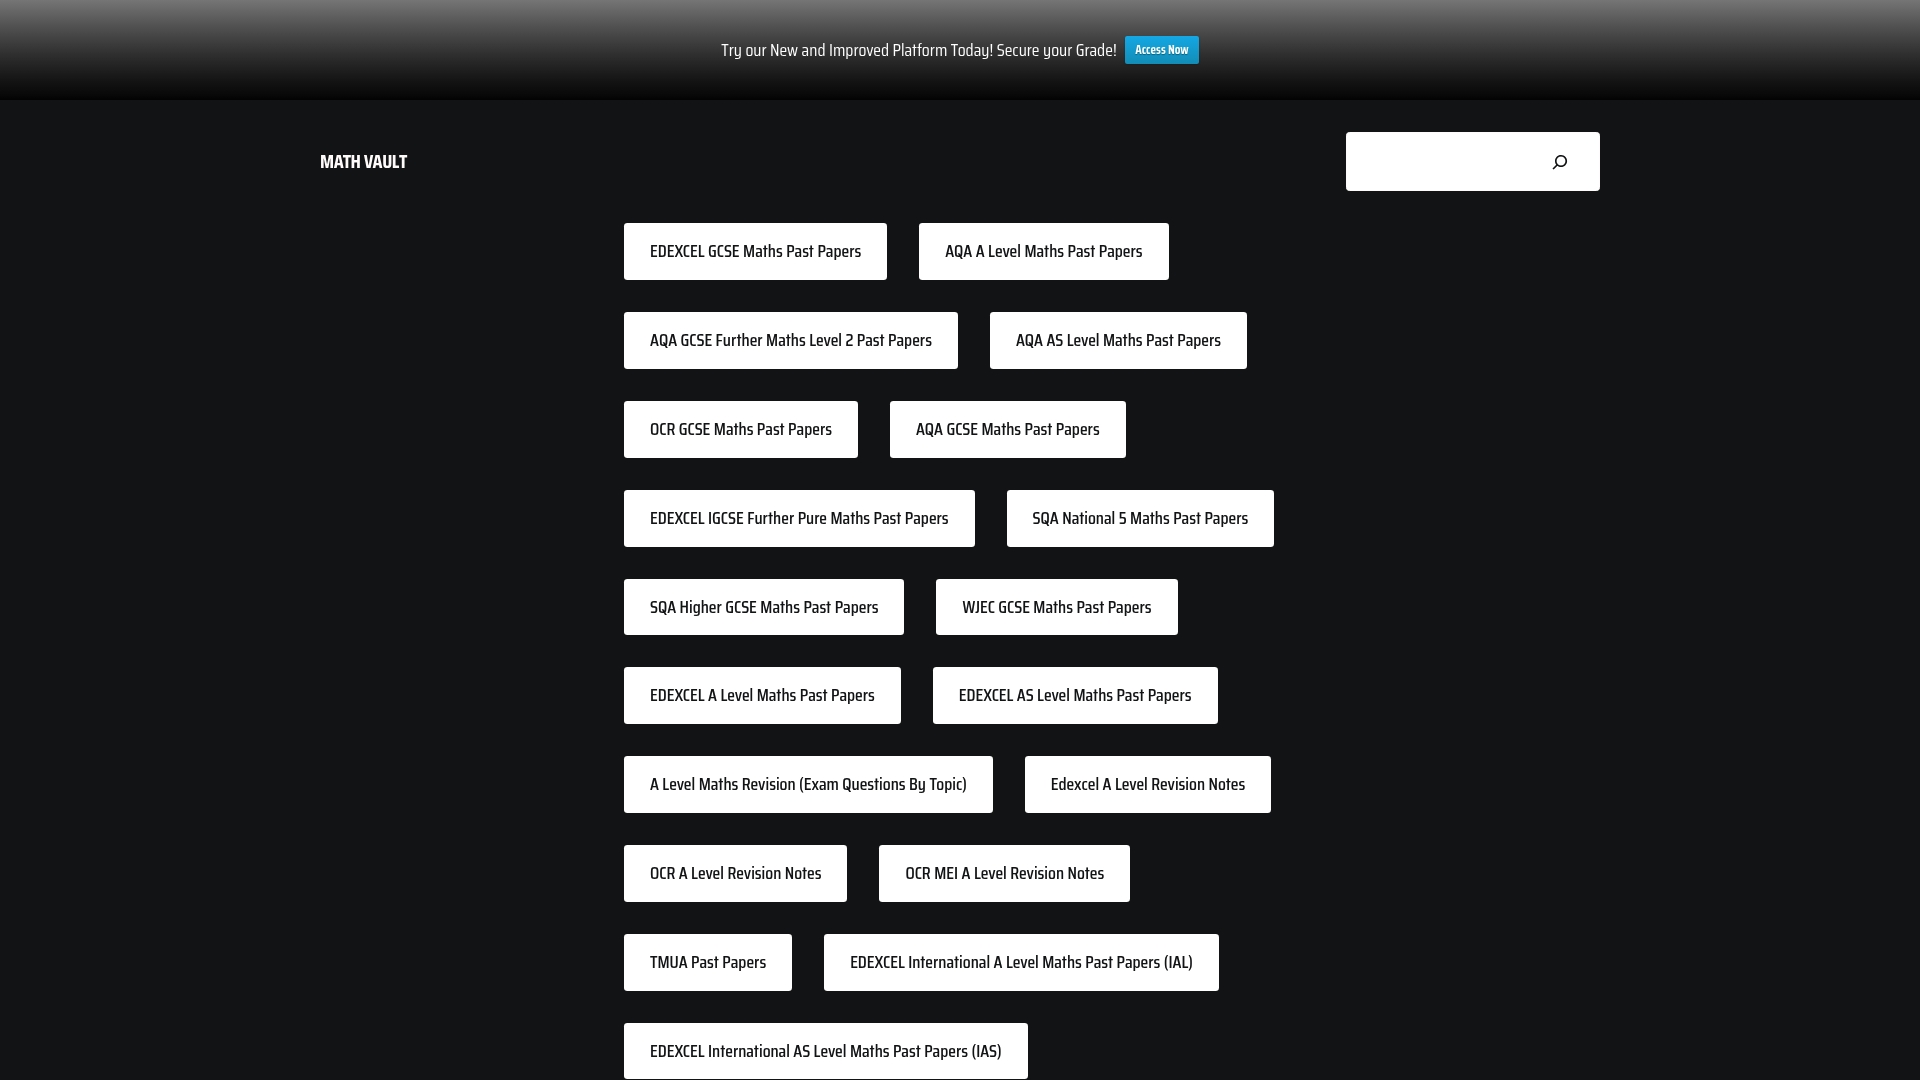
If you sit Edexcel, our past-paper questions by topic let you drill graph questions specifically, with worked solutions showing exactly how method marks are earned. Visit the revision guides page to find the pack that matches your exam board and start practising today.
Sources
- How to plot a linear equation graph – BBC Bitesize
- AQA guidance on sketching and recognising functions
- OCR sketching topic exploration pack
- How to sketch graphs | NRICH
- Drawing charts and graphs | Royal Geographical Society
FAQ
What is the most accurate way to draw a graph by hand?
Build a table of values, choose axes and a scale using the 1,2,5 progression so your data fills more than half the grid, then plot each ordered pair precisely before drawing a ruled line or smooth curve. This is the process BBC Bitesize recommends for plotting linear equations, and it extends naturally to quadratics, cubics and trig functions.
How do I choose the right scale for a graph?
Pick main axis divisions from the 1,2,5 ladder (1, 2, 5, 10, 20, 50 and so on) so the numbers are easy to read and interpolate, as recommended in RGS guidance on drawing graphs. Choose a scale that lets your plotted data occupy more than half of the available grid space.
Can I use GeoGebra or Desmos in my exam?
No, exams require you to plot graphs by hand using a pencil, ruler and table of values, since these tools are not permitted in the exam room. GeoGebra and Desmos are useful for checking your work while revising, but OCR’s transition guidance is clear that software supports practice rather than replacing the hand-drawn method.
How do I know if I have the right shape for a graph?
Compare your curve against the parent shape for that function family: a quadratic should be a symmetric curve through its vertex, a reciprocal graph should show two smooth branches approaching its asymptotes, and a cubic should show the correct end behaviour. AQA’s sketching guidance expects these characteristic shapes rather than a series of disconnected points.
What common mistakes lose marks when drawing graphs?
Joining non-linear points with straight segments, missing axis labels or units, and failing to show your table of values are frequent causes of lost marks. Showing your substitutions and calculations clearly, as NRICH suggests, helps secure method marks even when the final curve has a small inaccuracy.
Leave a Reply