
Official A level maths grade boundaries are published by each exam board, Edexcel/Pearson, AQA, and OCR, and they vary by board, paper, and year. Check your board’s 2026 grade-boundary PDF or online results page for the exact raw-mark cutoffs. Pre-results predictions are only estimates, so treat any calculator as a guide until results day confirms the real figures.
TL;DR:
- Grade boundaries vary by exam board, paper, and year, requiring students to check the specific 2026 PDF for accurate raw mark cutoffs.
- Boundaries are recalculated annually based on statistical data and examiner reviews to account for paper difficulty and cohort performance.
- Converting raw marks to grades involves matching your total score to the official boundary table for your exam series and board; reading the overall boundary column is essential.
- A score of around 70% does not guarantee an A grade due to shifting boundaries and differing standards across boards and years.
- Rely only on official PDFs and GOV.UK guidance for boundary information, and treat online calculators as approximate tools, updating expectations after results are confirmed.
Table of Contents
- Latest A level maths grade boundaries by exam board, 2022 to 2026
- Why do A level maths grade boundaries change every year?
- How to convert raw marks to your A level maths grade
- What do 70%, 60%, and 50% actually mean in A level maths?
- Which grade calculators and boundary tools are actually reliable?
- What should you do if your marks land near a grade boundary?
- Reading the boundaries without losing sight of what matters
- Practise with the right board’s papers before your next attempt
- Sources
Latest A level maths grade boundaries by exam board, 2022 to 2026
Grade boundaries tell you the minimum raw mark needed for each grade, and every board publishes its own set after results day. The three boards that award A level maths in England, Wales, and Northern Ireland, Pearson/Edexcel, AQA, and OCR, release their tables on the same day results go out, and each covers overall subject totals as well as individual paper cutoffs.
Pearson’s June 2026 documentation lists overall A level maths boundaries out of 300 marks, with separate tables for each of the three papers that make up the specification. AQA structures its PDF similarly, listing subject codes alongside raw-mark cutoffs for A*, A, B, C, D, and E. OCR takes a slightly different approach, publishing its grade scales as a reference to the letters used (A*, A, B, C, D, E, U) alongside links through to the year’s specific boundary documents rather than one combined table.
A typical overall boundary row for a 300-mark A level maths paper set looks like this, based on the kind of figures Pearson’s subject grade boundary tables publish each year:
A few things to keep in mind when reading these tables yourself:
- Boundaries are specific to one series (June, in most cases) and one year, so never mix a 2024 table with a 2026 result.
- Per-paper boundaries usually sit in a separate section of the same PDF, further down than the overall subject boundary.
- AQA and Pearson format their documents differently, so match column headings carefully rather than assuming the layout is identical across boards.
Why do A level maths grade boundaries change every year?
Boundaries move because exam boards recalculate them after every series, rather than fixing a raw-mark target in advance. Two things drive the decision.
- Statistical evidence. Boards look at how the current cohort performed compared with previous years, using prior attainment data as a benchmark.
- Senior examiner review. A panel of senior examiners reads sample scripts at the proposed boundary marks to check the quality of work matches the standard expected for that grade.
GOV.UK confirms this process aims to preserve the value of a grade across years, not to lock it to a fixed percentage. That is also where the National Reference Test, run by Ofqual, feeds in, giving boards an independent check on whether national performance has genuinely shifted. In practice, this means a 70% raw score one year and a 68% raw score the next could both earn an A, because the marks needed adjust to reflect how challenging that year’s papers actually were.
How to convert raw marks to your A level maths grade
Converting raw marks into a grade is simpler than it sounds once you have the right documents in front of you. Follow these steps:
- Collect your raw marks for each paper (Pure Maths papers 1 and 2, plus Statistics and Mechanics) directly from your exam board’s mark return or your school.
- Find the matching year’s PDF from your board, never a previous year’s table, and locate both the per-paper and overall boundaries.
- Check for weighting. Most A level maths specifications simply sum the three raw paper marks out of 100 each for a total out of 300, with no additional scaling.
- Add your scaled marks together to get your overall raw total, then compare it against the overall boundary table.
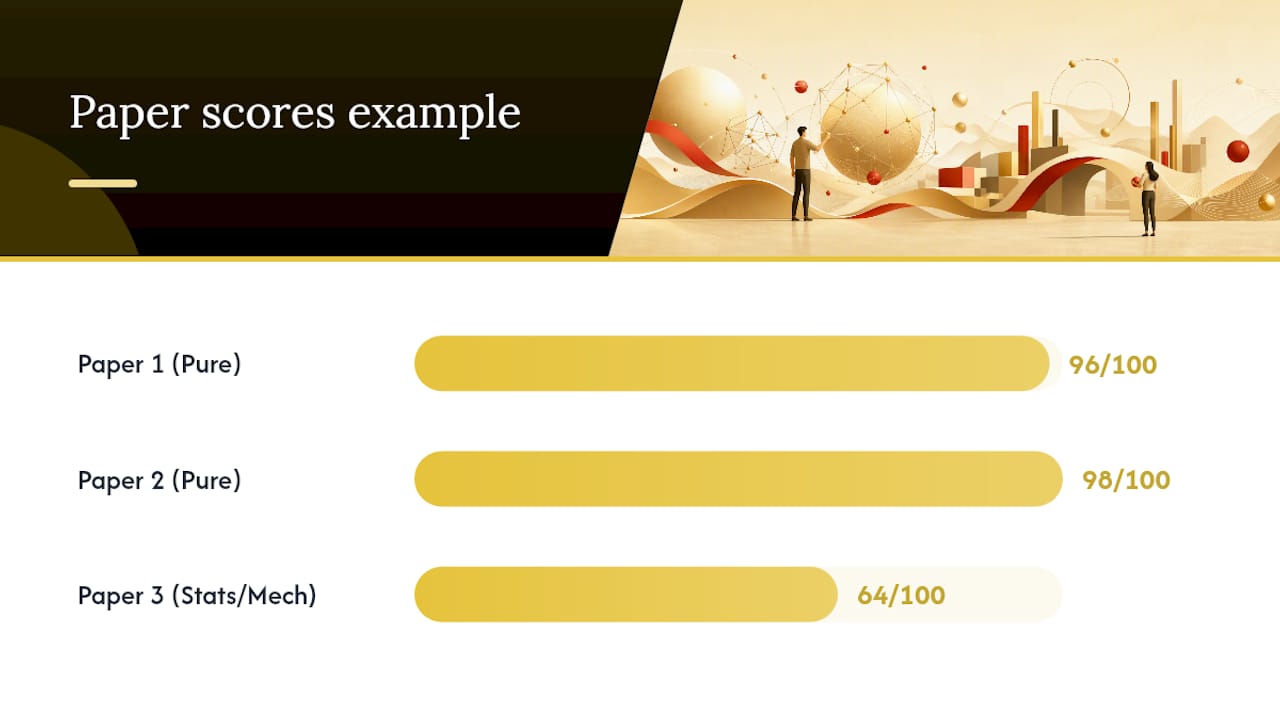
Take a worked example using Pearson’s published cutoffs for a 300-mark specification: if you scored 96, 98, and 64 across your three papers, your total is 258. Against the boundaries shown earlier, that total sits exactly at the A* cutoff.
Pro Tip: Always double-check you are reading the overall boundary column, not a single paper’s boundary. Students commonly compare their total mark against a per-paper cutoff by mistake, which produces a completely wrong grade estimate.
What do 70%, 60%, and 50% actually mean in A level maths?
Percentage scores get thrown around a lot in staffroom and revision conversations, but they map to different grades depending on the board and year. Because boundaries move to reflect paper difficulty, a “70% pass” rule of thumb is unreliable.
| Raw percentage (out of 300) | Typical grade range |
|---|---|
| — | A* |
| 70% | A |
| — | B |
| — | C |
| — | D |
These figures echo the pattern seen in Pearson’s June 2026 grade boundary PDF, where 300 marks is the maximum. A score of 70% could sit comfortably inside an A band in a year with harder papers, or drop closer to a B in a year where the cohort scored higher overall.
- A single percentage figure never guarantees a fixed grade across years.
- Boards can differ by several raw marks for the same grade in the same year.
- Always compare against the exact board and year you sat.
Which grade calculators and boundary tools are actually reliable?
The only fully reliable sources are the boards’ own PDFs and GOV.UK’s grading guidance, because every third-party calculator ultimately has to reference those same numbers. Before trusting any online tool, check three things:
- Does it name the exact exam series (June 2026, for example) and board it is using?
- Does it link back to the original PDF so you can verify the figures yourself?
- Does it distinguish between predictive, pre-results estimates and confirmed post-results boundaries?
No predictive model can guarantee exact cutoffs before results day, because boundaries are only finalised once senior examiners have reviewed real scripts. Treat any pre-results calculator as indicative and update your expectations once your board’s official document goes live. For practice that matches the right standard, Mathvault’s board-aligned past papers let you work through questions and mark schemes calibrated to the specifications these boundaries are drawn from.
What should you do if your marks land near a grade boundary?
A mark within a few points of a boundary is not a lottery ticket, it is a signal about which topics to fix before your next attempt or resit. Start here:
- Pull your examiner report for the paper in question and note recurring comments about method marks lost to poor working or misread questions.
- List your three weakest topic areas from mock results or past paper practice, and rank them by how many marks they typically carry.
- Set a focused two to three-week plan, spending most sessions on those high-value topics rather than spreading revision thinly across everything.
- Redo past paper questions by topic so you are practising the exact skill that cost you marks, not just repeating full papers.
Pro Tip: Mark schemes reward method as much as final answers. Reading a few examiner reports alongside past papers organised by topic often reveals that small, fixable habits, like not showing intermediate steps, are the real reason marks sit just below a boundary.
Reading the boundaries without losing sight of what matters
Grade boundaries move every year, and chasing last year’s cutoff as if it were fixed is a losing strategy. What holds steady is the mark scheme’s logic: method marks, accuracy marks, and clear working reward genuine understanding regardless of where the line falls that year.
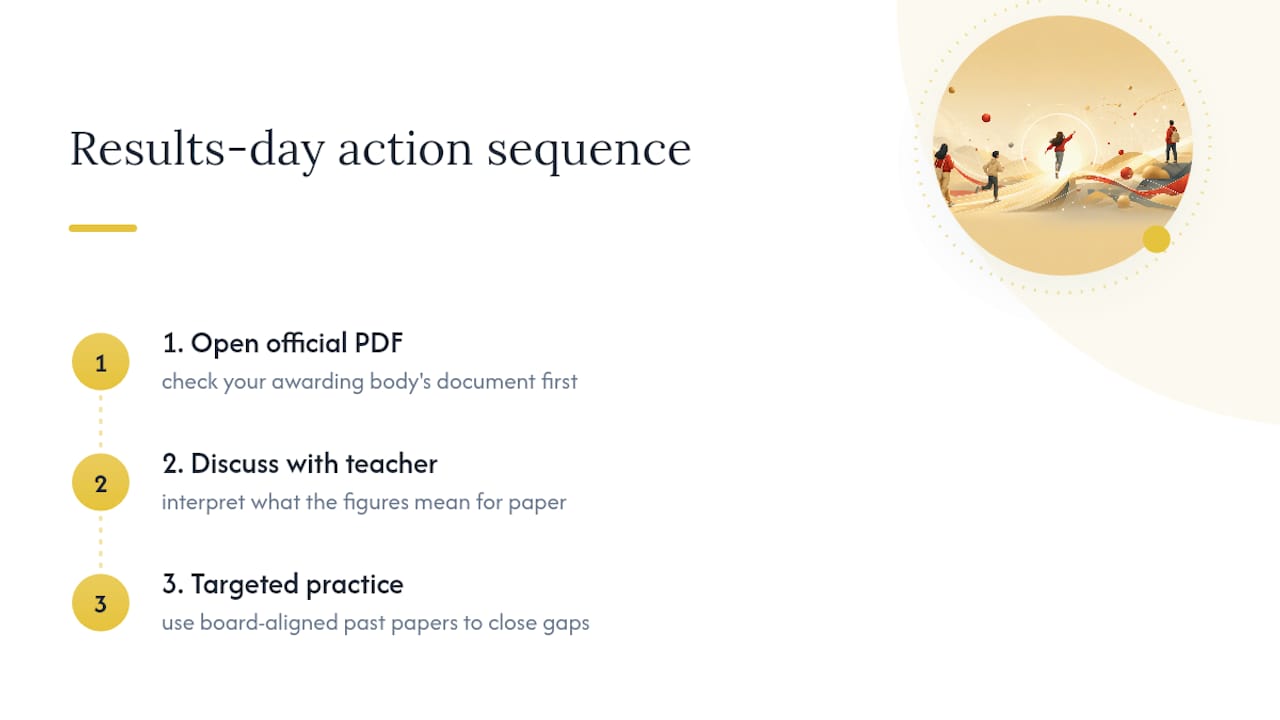
On results day, the sequence that actually helps is simple. Check your board’s official PDF first, talk to your teacher about what the figures mean for your specific paper, then use targeted, board-aligned past papers to close any gaps before a resit or the next stage of study. Boundaries reward mastery, not guesswork about where a line will land.
— Oloru
Practise with the right board’s papers before your next attempt
There are other ways to revise for A level maths, generic revision guides, YouTube playlists, scattered worksheets, but none of them are matched to your exact board’s mark scheme and paper structure the way board-aligned past papers are. Access free fully worked solutions and video walkthroughs organised by exam board, so the practice you do this week reflects the exact standard your boundary table was built from.
If you sit Edexcel, the Edexcel A level maths past paper questions by topic pack breaks practice down by topic rather than by full paper, which is exactly how you close a near-boundary gap fastest. AQA students have an equivalent set of board-aligned revision resources covering the same specification structure examiners use when setting boundaries. Both include fully worked solutions, so you can check your method against what actually earns marks, not just whether your final answer matches. Start with your weakest topic area from your last mock and work through the matching past paper pack today.
Sources
- Gov
- Grade boundaries Edexcel GCE AS/A Level June 2026 — Pearson
- A level grade boundaries — AQA (June 2026 PDF)
- Grade scales — OCR
Leave a Reply